 geocatalogue.geoportail.lu
Energy, renewable, building integrated photovoltaic, potential
Type of resources
Available actions
Topics
Keywords
Contact for the resource
Provided by
Groups
Representation types
Update frequencies
status
Scale
-
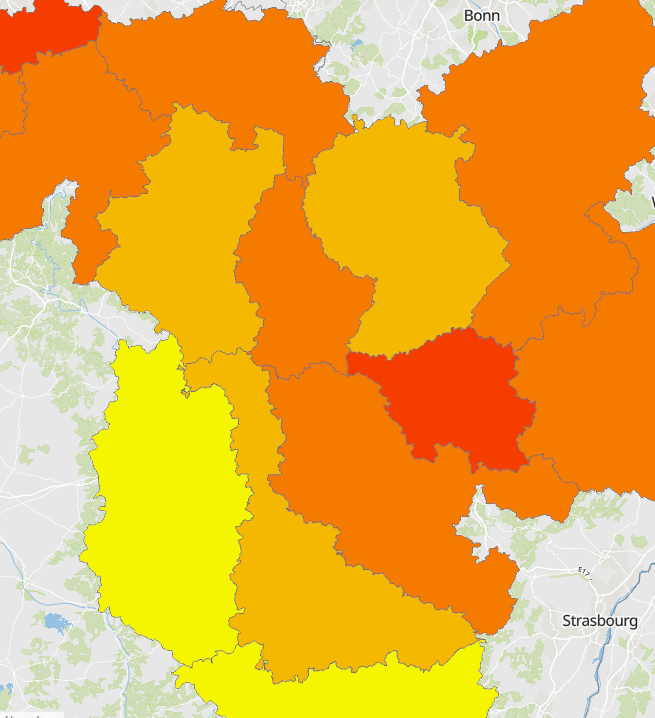
Technical potential of building-integrated photovoltaic at NUTS 2-3 level - Geodata sources (administrative entities): ACT Luxembourg 2017, IGN France 2017, GeoBasis-DE / BKG 2017, NGI-Belgium 2017. Harmonization: SIG-GR / GIS-GR 2020 - Thematic data sources: © SolarGIS 2020 The World Bank; ACT Luxembourg 2021; LVGL GDZ 7/2021 ; EUROSTAT 2020; Hotmaps-Project 2020: https://www.hotmaps.hevs.ch/map (23.3.22). Harmonisation: © IZES gGmbH 2022 - Territorial entities: NUTS 2 (provinces in Wallonia, former Regierungsbezirke in Rhineland-Palatinate, Saarland, Luxembourg) and NUTS 3 (Departements in Lorraine) - The map shows the technically possible photovoltaic potential or the maximum possible potential on roof and façade surfaces in the Greater Region at municipality level. If you select a coloured area, further information on this area is displayed. They contain information on the calculated roof/façade area, potential electricity generation and power on roof and façade area in this territorial unit. This is a theoretical potential based on the calculations and the assumptions on which the calculations are based. Therefore, when using the data, it should be noted that the data is based on a statistical approach and represents an approximation or estimate of the potential.
-
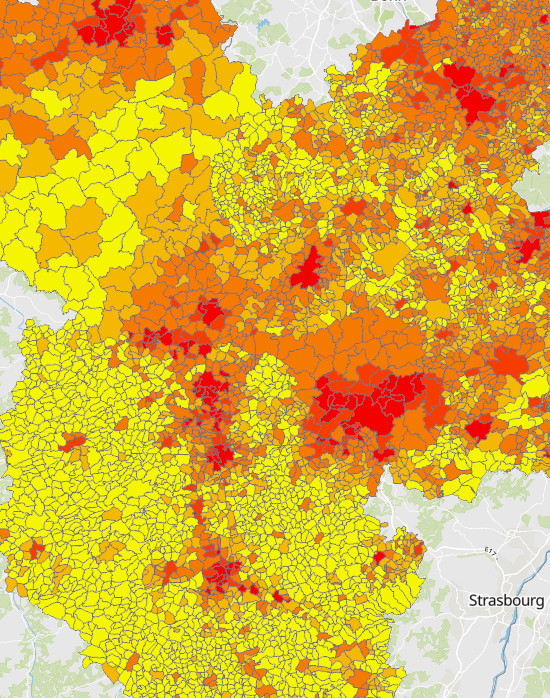
Technical potential of building-integrated photovoltaic at the municipal level - Geodata sources (administrative entities): ACT Luxembourg 2017, IGN France 2017, GeoBasis-DE / BKG 2017, NGI-Belgium 2017. Harmonization: SIG-GR / GIS-GR 2020 - Thematic data sources: © SolarGIS 2020 The World Bank; ACT Luxembourg 2021; LVGL GDZ 7/2021 ; EUROSTAT 2020; Hotmaps-Project 2020: https://www.hotmaps.hevs.ch/map (23.3.22). Harmonisation: © IZES gGmbH 2022 - Territorial entities: municipalities - The map shows the technically possible photovoltaic potential or the maximum possible potential on roof and façade surfaces in the Greater Region at municipality level. If you select a coloured area, further information on this area is displayed. They contain information on the calculated roof/façade area, potential electricity generation and power on roof and façade area in this territorial unit. This is a theoretical potential based on the calculations and the assumptions on which the calculations are based. Therefore, when using the data, it should be noted that the data is based on a statistical approach and represents an approximation or estimate of the potential.
-
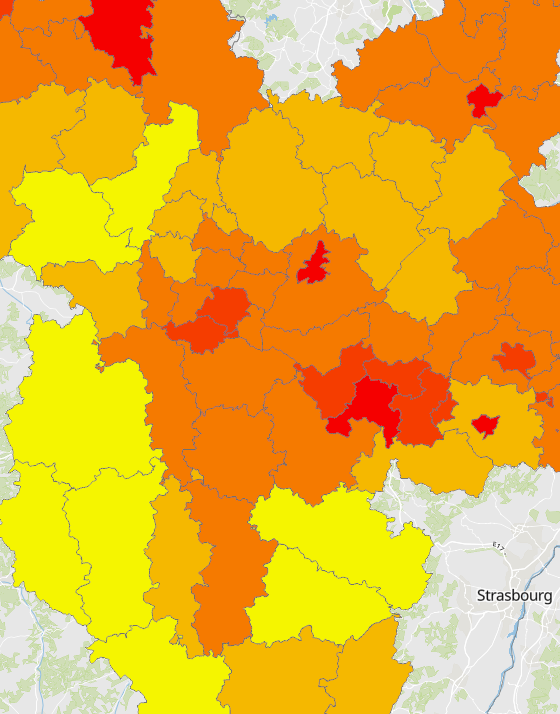
Technical potential of building-integrated photovoltaic at the level of Kreise, arrondissements and cantons - Geodata sources (administrative entities): ACT Luxembourg 2017, IGN France 2017, GeoBasis-DE / BKG 2017, NGI-Belgium 2017. Harmonization: SIG-GR / GIS-GR 2020 - Thematic data sources: © SolarGIS 2020 The World Bank; ACT Luxembourg 2021; LVGL GDZ 7/2021 ; EUROSTAT 2020; Hotmaps-Project 2020: https://www.hotmaps.hevs.ch/map (23.3.22). Harmonisation: © IZES gGmbH 2022 - Territorial entities: Kreise (Rhineland-Palatinate and Saarland), Arrondissements (Wallonia and Lorraine), cantons (Luxembourg) - The map shows the technically possible photovoltaic potential or the maximum possible potential on roof and façade surfaces in the Greater Region at municipality level. If you select a coloured area, further information on this area is displayed. They contain information on the calculated roof/façade area, potential electricity generation and power on roof and façade area in this territorial unit. This is a theoretical potential based on the calculations and the assumptions on which the calculations are based. Therefore, when using the data, it should be noted that the data is based on a statistical approach and represents an approximation or estimate of the potential.